Tuesday, October 25, 2022

TE probe characteristics

As XC Vario is recording the different pressures available on my glider, namely static PS, dynamic pressure Q & TE probe PTE, it is possible to study them.
Anemometric calibration curve of LS6 being quite good, as showing low error of IAS vs CAS, it means in particular than static measuremnt is of good quality.

DLR-measured anemo calibration curves for LS6 (1986)

As a result, it is possible to build TE pressure coefficient with a reasonable confidence in the absolute level. TE pressure coefficient is defined as follows :

CP_TE=(PTE-PS)/Q

To have a good compensation antenna, value for this pressure coefficient should be CP_TE=-1.
Now, let's see what we measure in flight on the LS6, which is fitted with a venturi-type compensation antenna. 

First, a phugoid manoeuver is showing a good range of speed with minimum stick input. Below is plotted the antenna pressure coefficient as function of indicated airspeed.

TE pressure coefficient in phugoid

It can be observed that my antenna is not a perfect, as being 5 to 10% off vs desired value for typical cruise speeds.
As pressure coefficient is more negative than desired, it means this antenna has a trend to over-compensate altitude variation for speed variations. In a typical pull up on a modern glider, speed variation  vs geometric altitude variation corresponds to a ~10m/s correction term, meaning a 5% error on the coefficient makes ~0.5m/s error on variometer reading.
As well to ne noted : when reaching low speed range, the antenna over-compensation behavior is increasing.

In real life, TE pressure is exposed to many perturbations : turbulence, sideslip, angle of attack, pilot input, etc... Ideally the local pressure coefficient would stay imune to those parameter, but this is actually  not the case. As a result, TE pressure is affected by some measurement noise, that is at the end polluting variometer readings.
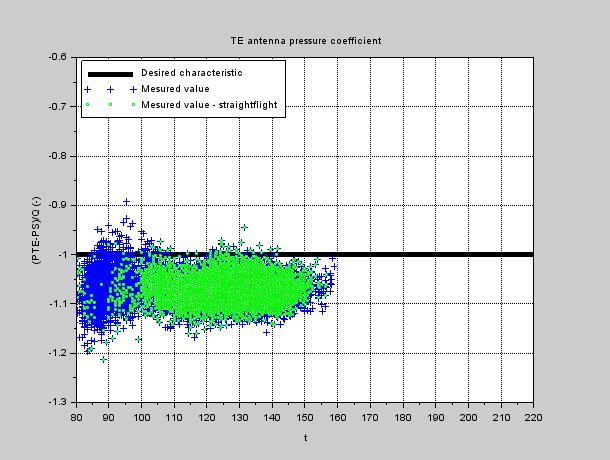
Below is the TE pressure coefficient recorded over 30min during one of my XC-country flight, showing an example of "real life" situation.

TE pressure coefficient while flying in southern alps, from Col de Vars to Crete de Peyrolle

In contrast to the relatively ideal phugoid manoeuver, it can be observed that pressure coefficient versus speed is quite noisy, especially for low speed, with either over- or under-compensation behavior.
When on top we isolate points corresponding to wings levels (in green), it appears that the low speed noise is very much related to circling phase. In thermals, probability for turbulence or for non symetric flight is higher, both likely to expose TE probe to undue perturbations. Noise is less in straight flight, but does exist as well.

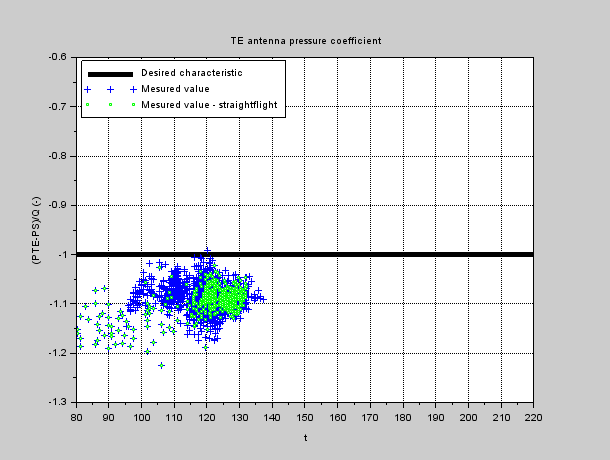
Below is a collection of time slices analysed from a TE antenna characteristic, to start getting a sense of statistics & patterns. From left to right & top to bottom : clound street flying, low altitude hang flying, High mountaign area flying, low start over hill in weak lift, small wave flying, landing


 Performing similar measurement for different antenna would be interesting, but was not done so far.

As a final note, it can be either concluded I have a bad TE antenna, or that reliable variometer without an antenna would be a benefit...


Sunday, October 23, 2022

2022 Landing survey

 In August this year, I had a bit of a rough landing, or at least it felt as such. It was the classical LS6 trap : too slow on final approach with Landing flap configuration extended, resulting into nose up attitude in flare to compensate for quasi-stalled status, and tails hitting the ground first.

During 2022 season, quite a lot of data was recorded using the XC vario installed on the LS6. I have taken here the opportunity to have a survey on glider parameters during some of the landings, with the objective to analyse the specific rough landing event.

In a first plot, indicated airspeed is plotted over the last 30 second before touch down, as well as the difference between airspeed & ground speed (hence vertical wind profile) in the last 60m above touch down. Touch down is then hapenning @ t=0/Zp=0.

Indicated speed vs time & vertical profile of headwind

Those plots cover landings on 3 airfields : Aire sur adours in may, Moissac in July & August, St Auban end of August/beg September.  The rough landing happened on the 15th of august at my home airfield of Moissac, corresponding to red curve.

Here are some basic observations :

  •  In the landings recorded, indicated airspeed reading in approach (left curves), 20sec before touch down, varies from 95kph to 120kph.
    Recordings are converging at touch down toward a 80-to-90kph narrower band.
  • 15th of august landing (red) happened for the approach at the lowest speed
    --> 95 kph 20sec before touch down, 90kph 2sec before touch down, 80kph at touch down
    AND it resulted in a landing perceived as rough
  • July flight (black) was performed with a speed almost as low
    --> 95 kph 20sec before touch down, 90kph 2sec before touch down, 85kph at touch down
    BUT it did not result in a landing perceived as rough
  • Difference between red & black is the wind (right curves) : in july there was virtually no wind, whereas 15th of august landing happened in a moderate wind (~15kph in altitude), showing a 5 to 10kph wind gradient over the last 5m over ground

What is being taught to pupils ("you shall increased your approach speed on windy days") is here shown measurable, since very similar speed scheduling resulted in a different outcome at touchdown on a calm & on a windy day.
On the other hand, approach realised with greater speed margin repeatably led to "normal landing" feeling, even in wind up to 30kph.

More measurements are available from XC vario sensors : in a second plot, altitude & velocity time histories are presented over the last 30seconds before touch down, as well as vertical velocity, vertical accelerometer reading, pitch attitude & pitch rate in the last 5 seconds before touche down.

Time history for altitude, indicated airspeed, vertical speed & acceleration, pitch & pitch rate

Here are a few observations :

  •  It looks like I tend to realise lower approach at my home airfield (red, black, green) than on other airfields...
  • Like for airspeed, altitude time histories converges into a narrow band over the last 20m/10sec before touch down
  • Rolling phases correspond to high noise on many sensor of XCs vario (static & differential pressures, accelerations, roations rates), corresponding both to higher excitation (runways are not always regular) and local vibration behavior for the canopy mounted XC vario instrument.

More specificaly related to the sensation for a rough landing :

  • Red corresponds to the highest vertical speed at touch down, and black the closest to zero : it confirms the different perception at touch down for those two "low indicated speed approaches".
  • On green curve, 3-to-2 sec before touch down there is a anticipated flare, with temporary nose up attitude resulting in vertical speed reduction.
    It constrasts with red, for which nose up attitude just before touch down seems to have had no impact on vertical speed variation rate. Likely, quasi-stalled wing status due to lower speed/higher aoa in the last seconds prevented wing lift to develop further following to pitch action, preventing fine tuning of the vertical trajectory.
  • Accelerometer is quite shaky once the glider is rolling, easily showing +2.7G reading whatever the landing : high values of positive Az does not correspond by itself to the feeling for a rough landing.
    On the other hand, red curve shows at touch down a significantly negative reading (-2.7Gs) followed by a significant positive value (+3.1Gs). This signature is likely to results in the perception of a rough landing.
  • This specific signature can be understood as follows :
    • Red curves shows the highest pitch attitude at touch down
    • A significant nose down pitch rate after touch down ishould be the signature for a tail strike.
      Negative pitch acceleration results in a negative vertical acceleration measured on the instrument panel location - but also in pilot stomach to a certain extend...
    • Shortly after tail, main wheel is touching the ground as well, stopping the pitch down motion & restoring positive acceleration felt in the canopy of the glider & in pilot's stomach...

All in all, recording XC-vario parameters proved very usefull to understand what happened, recalling the basics that I was taught as a pupil in term of speed scheduling in approach...